Monitor GL.inet MT3000 with Grafana

Monitor GL.inet MT3000 with Grafana
Beryl AX (GL-MT3000)
Beryl AX (GL-MT3000) is an AX3000 pocket-sized travel router that uses the Wi-Fi 6 protocol.
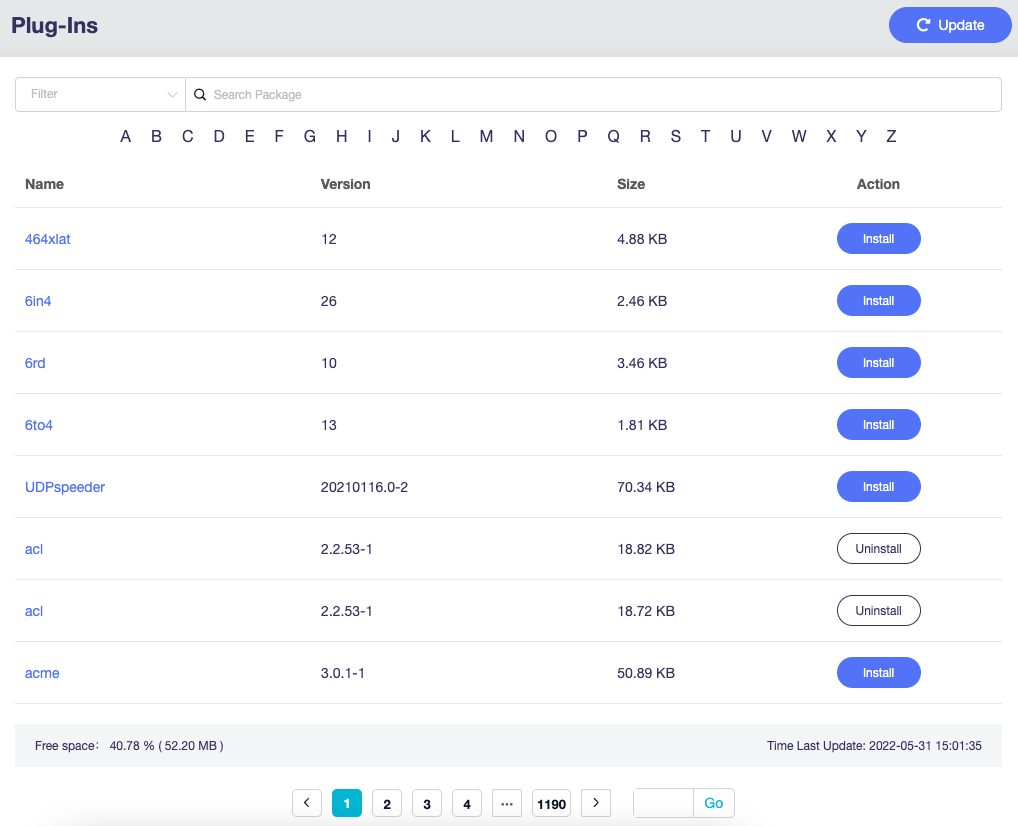
On the left side of web Admin Panel -> APPLICATIONS -> Plug-ins
Install the following packages:
prometheus-node-exporter-lua
prometheus-node-exporter-lua-nat_traffic
prometheus-node-exporter-lua-netstat
prometheus-node-exporter-lua-openwrt
prometheus-node-exporter-lua-wifi
prometheus-node-exporter-lua-wifi_stations
SSH to GL-MT3000
1
ssh root@router-ip
Update prometheus-node-exporter-lua
1
vi /etc/config/prometheus-node-exporter-lua
1
2
3
4
config prometheus-node-exporter-lua 'main'
        option listen_ipv6 '0'
        option listen_port '9100'
        option listen_interface 'lan'
Restart prometheus-node-exporter-lua
1
/etc/init.d/prometheus-node-exporter-lua restart
Check the status
1
/etc/init.d/prometheus-node-exporter-lua status
Prometheus
Update .\prometheus\prometheus.yml file
  - job_name: 'OpenWrt'
    static_configs:
      - targets: ['glinetMT3000:9100']
Reboot Prometheus
1
sudo systemctl restart prometheus.service
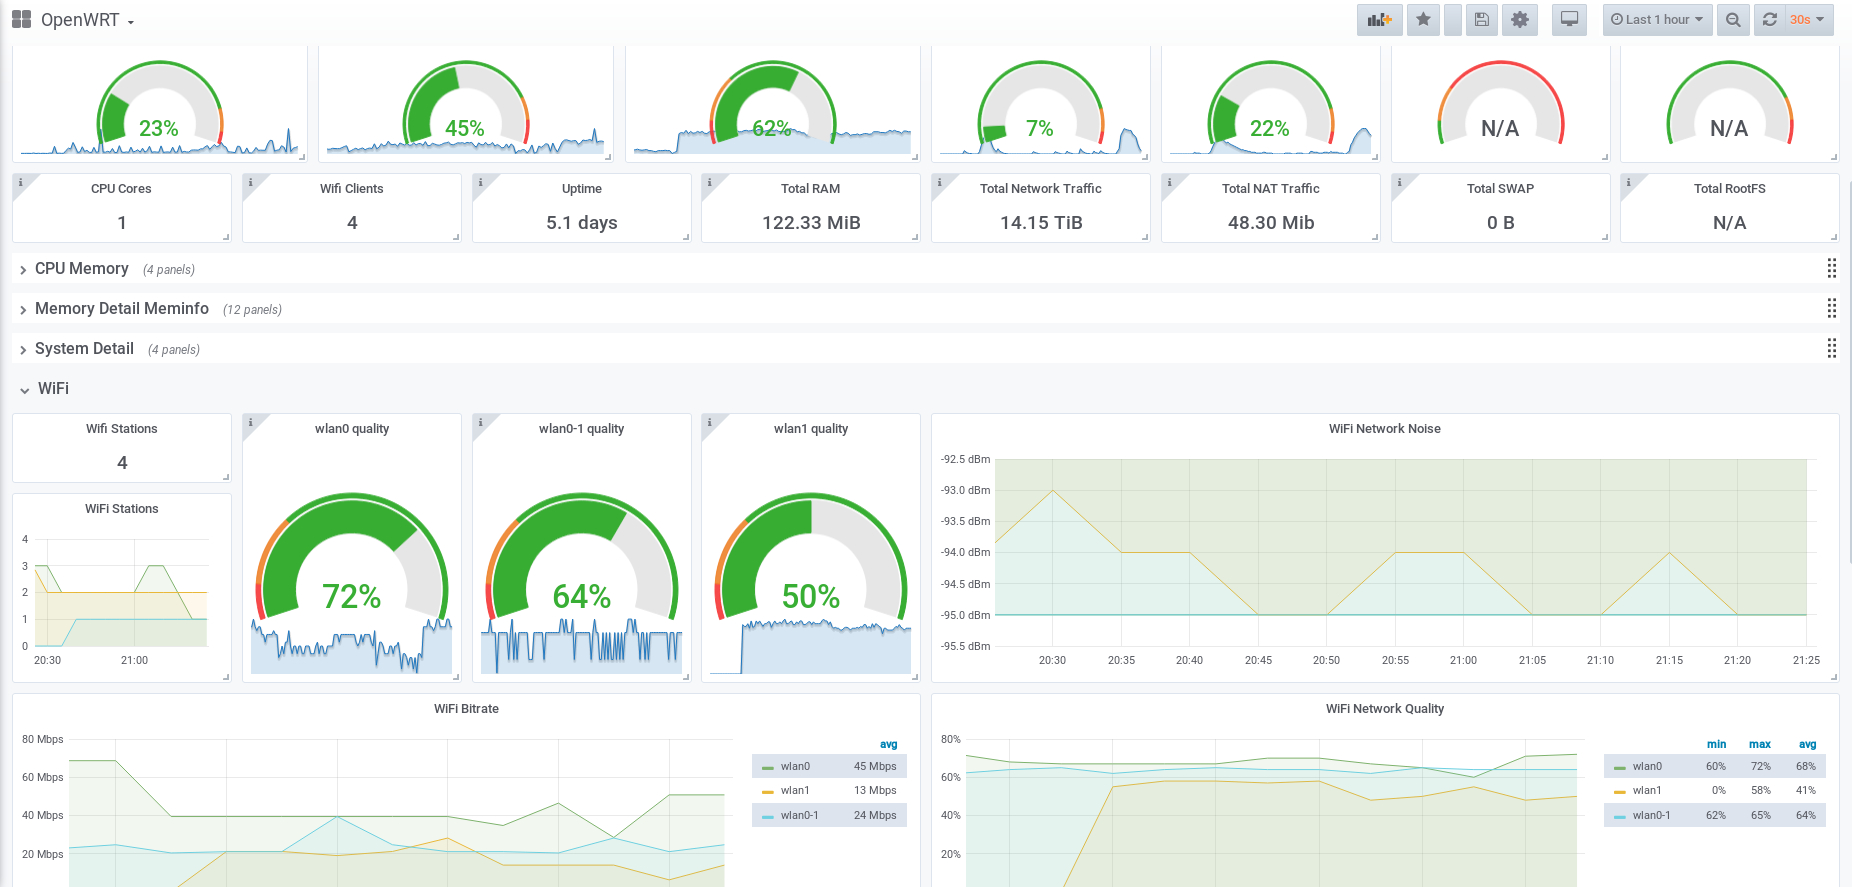
Grafana
Add a new dashboard ID 11147
Sources
Photo by Behnam Norouzi on Unsplash
How I monitor my OpenWrt router with Grafana Cloud and Prometheus https://grafana.com/blog/2021/02/09/how-i-monitor-my-openwrt-router-with-grafana-cloud-and-prometheus/
Beryl AX (GL-MT3000) https://www.gl-inet.com/products/gl-mt3000/
Dashboard for OpenWRT routers with installed lua scripts. https://grafana.com/grafana/dashboards/11147-openwrt/
Want to thank me?
🤝 Buy me a coffee https://buymeacoffee.com/dbplatz
This post is licensed under CC BY 4.0 by the author.